A paper I co-authored a year back has just been accepted into EdMedia 2006.
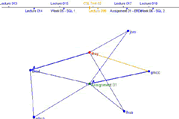
The theory of the paper was basically using a visualisation technique to display the “relationships” between students in online education courses.
One of the interesting things I found was that it was very easy for the lecturer to “dominate” discussion forums by responding to every message. The visualisation made it clear that the discussion became very “hub-and-spoke” with the lecturer in the middle and students on the periphery.
If lecturers delayed in responding just a little, the profile of the discussions changed and a group of “core” students would be drawn into the centre of the discussion.
The opportunities for using this in real course discussions are quite appealing because it would encourage lecturers to think more about the “overall” picture of the “health” of a given discussion topic rather than the immediate problem of answering students’ questions.
The conference is in Orlando in June. Hmm….


Abstract below:
Applications that provide a graphical visualization of individuals engaged in on-line chatting may provide a novel insight into the processes and ultimate success of academically focused discussions within an enterprise learning management system. This prototype provides an insight into student-professor and student-student interaction based upon a time-based graphical representation of the social networks in action. It is a challenge to quickly monitor the effectiveness of discussion forums within large enrolment online classes. Visualization tools may help.