 As I have no doubt mentioned before, one of the perks of my job is I get to work with some very smart people. People who got degrees in pure mathematics because they were simply so geeky they couldn’t help themselves. So, what does a Maths geek do when he/she goes out into the workforce? Well, they program targeting systems for ships, perform calculations that allow us to know exactly where the bomb needs to be dropped, or, in the case of, George Dantzig (uber mathematics geek of the 1940’s) develop the simplex algorithm, for the very purpose of optimizing logistics for the US military during World War 2. Maths is sexy, and maths can kill.
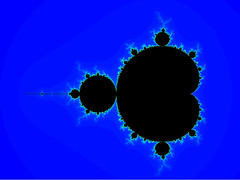
 So, it’s always exciting to have a discussion with one of the maths geeks at work. On Thursday, a colleague (who, I am told, actually has programmed some pretty dangerous stuff) showed me this cool construct which is his computer background: a Mandlebrot set. All the diagrams here, I drew myself.
Ok, so anyone can look at a Mandlebrot and say “wow, that’s pretty. But really, what does it mean? Why do mathematics geeks get all weak in the knees when they see one? Why doesn’t he have sexy women or cars on his background? To understand that, we need to delve deeper into the mathematics. Come on, join me, it’ll be fun, pretty and exciting.
When you went to high school, you most likely learnt how to solve equations like this:
(7 – x)2 – 16 = 0
We can solve for x and derive the value
(7 – x)2 = 16
7 – x = √16 = 4
x = 3
Ok, great, but what about:
x2 + 1 = 0
Hmm..
x2 = -1
x = √-1
 Aah, there’s no solution, you cry and draw a sad-face on your homework sheet. You can’t get the square root of a negative number, because anything multiplied by itself will always be a positive number. -2 * -2 = 4, 2 * 2 = 4, that’s it.
Ok, well, let’s play pretend, let’s pretend there’s a magic number, an imaginary number, which, when squared, equals -1.
So, then, in the above equation, we can say x = √-1 = i
Am I making things up? Well, yes and no. Mathematicians have denoted “i” to be the square root of negative 1. They also call it an imaginary number. So, I am only pretending as much as mathematicians do.
So, how does this help us? We know √-1 = i. Big deal. Well, we can also solve other problems:
(7 – z)2 + 16 = 0
(7 – z)2 = -16
7 – z = i √16 = 4i
z = 7 + 4i
In the case above, z is what mathematicians call a “complex” number. A “complex” number has both a real part and an imaginary part. In our example above, the real part is 7, and the imaginary part is 4i. In mathematics, “z” is commonly used to refer to a complex variable, whereas “x” is used for real ones.
 Haven’t you ever wondered why we have “integers” (whole numbers) and “real numbers” (integers and all the bits in between)? What are the unreal numbers, where do they fit? Complex numbers are the “unreal” numbers, in that they contain an imaginary component. Make sense? i is a complex number that has a zero real component (in other words: 0 + i1). Also, zero is both a real number and an imaginary number.
Ok, wonderful, so we have a number that’s made up of other numbers with imaginary stuff thrown in. What does this mean? Well, it means we can perform calculations on numbers we previously weren’t able to. We can add and subtract complex numbers, multiply or divide them. There are different rules for doing this which you can look up here if you want to.
Complex numbers are usually drawn on a graph, so we can see both the imaginary and the real parts of the number at the same time. The “x” axis of the graph is the real part, the “y” axis of the graph is the imaginary part. This sort of graph is called a complex plane, or Argand diagram. As you can see, I have plotted the value for z I calculated above on the graph (7 + 4i).
Ok, sweet, now what else can we do with these complex numbers?
Well, remember polynomials? A polynomial is a function, usually denoted by “f”. For example, we can say:
f(x) = x2 + 2
We can plot these on a graph, with the result of the function f on the y axis and the values of “x” on the x axis (where else).
Can we do the same with complex numbers? Yes, we sure can!
f(z) = z2 + 2
This function will give us a set of complex numbers for each different value of z we plug in. The only problem is, the result will also be a complex number. We can’t plot this on a two-dimensional plane, we’d need four dimensions (one each for real and imaginary parts of z, and another for the real and imaginary parts of the result of the function). Because we don’t have a 4D piece of paper, you’ll just have to imagine it (there’s that word again).
We can describe this function in more general terms by giving it a parameter “c” (which just so happens to also be complex):
fc(z) = z2 + c
 Great, so we have a general form of a complex quadratic equation, which we can’t draw because we don’t have 4D paper. So, how does this relate to Mandlebrot? Mandlebrot is a set of complex numbers drawn on a complex plane (see why I had to explain all that stuff above before we got to this point?) The Mandlebrot set of represents the values of c for which recursive function calls to f, escapes to infinity, starting at a critical value of 0.
Say what? Recursive what? Escape to what?
All good (if not very articulate) questions!
Firstly, let’s pass “0” into our function. We get a result which is f(0). Since f is a function which takes in a variable, we can get f to take in the result of itself, like so: f(f(0)). We can do it again and again, as many times as we like: f(f(f(f(f(0))))).
Each time we call the function is called an iteration. The number of iterations we do is “n”. In the example above, n = 5.
For some values of c, no matter how many times we call the function, the result is “stable”, it will never “escape” to infinity. For example, if c = 0, the result of f(0) will always be 0, no matter how many times we call it again and again. In contrast, if c = 1, calls to f would result in values of: 1, 2, 5, 26, 677, 458330, etc.
If c = 0.25, it stabalises at around 0.5, any higher than that, and it starts tending towards infinity. 0.25 is a real number, though, what happens if we throw complex numbers into the mix? Well, that’s when we get the mandlebrot set. The pretty colours are just showing how many iterations it takes for those values of c to escape to infinity. Red means few iterations, blue means lots of iterations, green is in between.
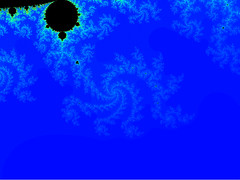
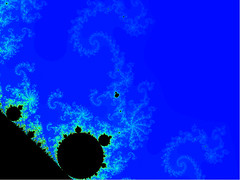
Because of the recursive nature of its definition, M (the mandlebrot set) is infinitely complex and quite often fractal. You can zoom into it at almost any point along its boundary and explore a beautiful vista of mathematics. I generated the video displayed below myself :).